Research
Screener
Find which stocks meet your conditions today, and save screens to run again.
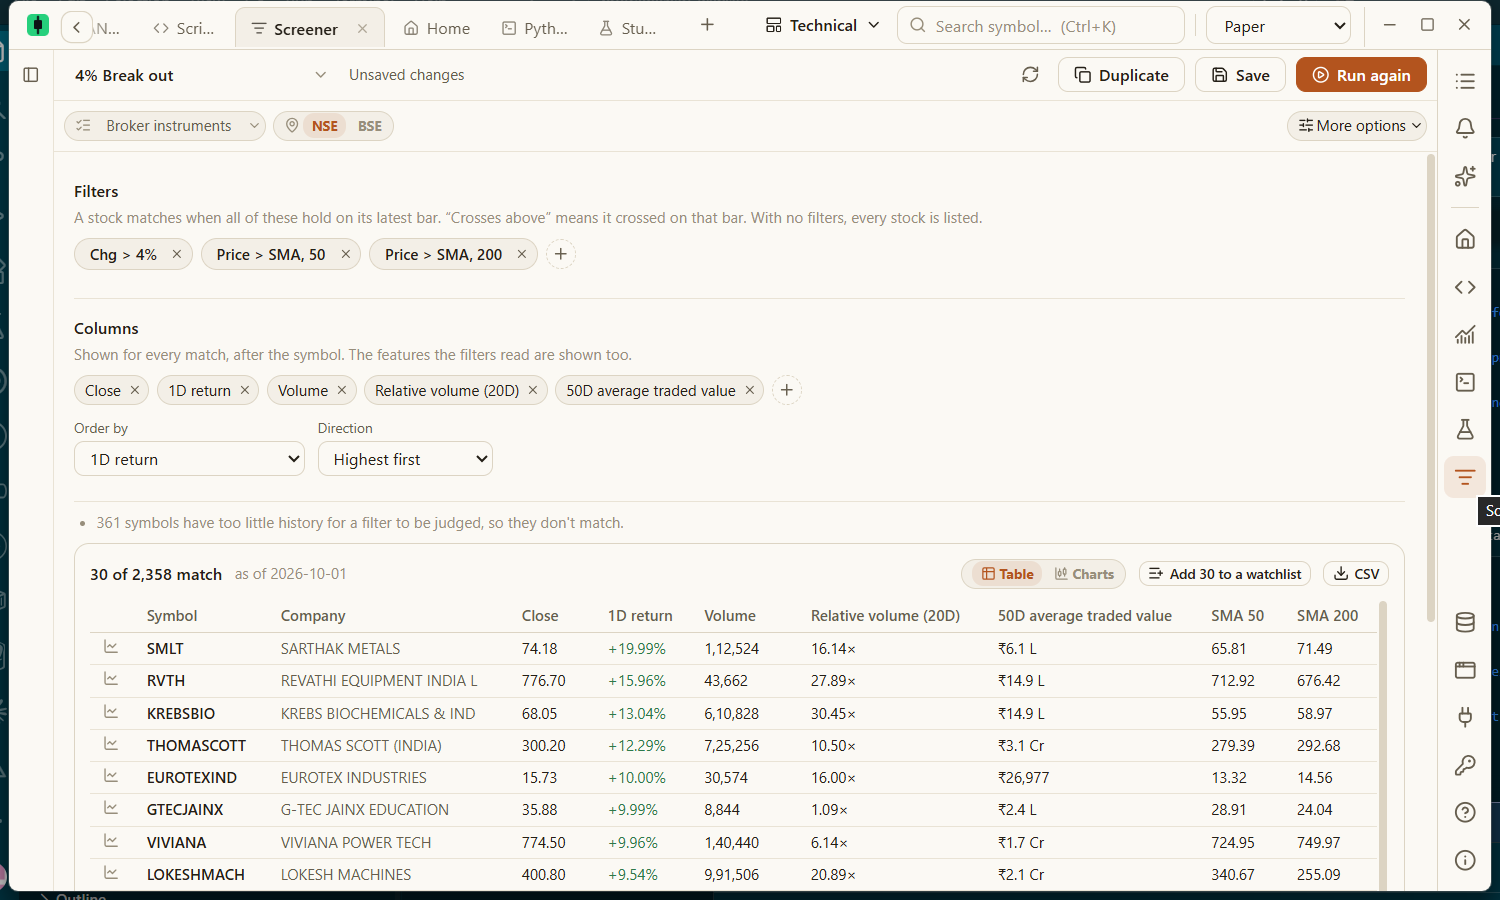
The Screener lists the stocks that meet a set of conditions on their latest daily bar, with the columns you choose. Open it from the Screener icon on the right rail.
Building a screen
- Start from a preset on the left (for example Near 52-week high or Volume spike), or press New screen.
- Under Filters, press + and pick a filter — grouped into Price, Volume, Moving averages, Oscillators, Performance and Volatility — or type to search. It appears as a chip such as
Chg > 2%. - Click a chip to edit it: set the length or period, the interval (1 day, 1 week or 1 month), a condition (Above, Below, Crosses above, Between, Outside …) and a value or another indicator.
- Under Columns, press + to choose the values shown for each match.
- Choose Order by and a direction.
- Set the universe with the Broker instruments / Watchlist / Symbol list pill and the NSE / BSE toggle. More options holds the rest.
- Press Run.
A stock matches when every filter holds on its latest bar. Percentages are typed as percentages — enter -5 for −5%.
Results
- Click a column heading to sort; click a row to open that stock's chart.
- Charts, beside Table above the results, shows the matches as daily candlestick charts instead — 1 × 1 up to 2 × 2 at a time, in the table's order. Use the arrows to page through them, click a stock's name to open it in a chart tab, and pick 1M, 3M, 6M, 1Y, 5Y or All for how much history each chart shows.
- Flag a match from the table or beside its chart: click the flag and pick a colour. The flag belongs to the symbol, so it shows on every watchlist.
- Add to a watchlist puts every match on a new or existing list. CSV saves the table.
- Symbols with too little history for a filter, or that have not traded for a week, are left out and counted in a note above the table.
Saving and speed
- Save keeps the screen under My screens, along with its last result.
- Filters on today's prices alone — close, open, high, low, volume, gap, and the day's change or return — are judged first on one quick quote of the whole universe, so only the stocks that pass have their history read. A screen made only of such filters finishes in seconds.
- With Keep the market loaded on, every NSE stock's history is in memory and a screen reads it in one go, in a couple of seconds. Without it, the first screen that needs history over a whole exchange fetches it at your broker's rate limit — about 15 minutes for NSE through Zerodha. What it fetched is held until the app closes, so later runs that day only top up each stock.
- Before it runs (under More options) estimates the broker requests and time needed. Try it on the first 100 symbols first gives a quick trial.