Getting started
First-time setup
A checklist to get from a fresh install to a fully working workspace.
ProTradeChart itself needs no account, but live Indian-market charts come from your own Zerodha account, so connecting it is the main setup step. This page walks through everything in the order that makes sense. Skip any step you do not need — you can come back to each one later from the Home tab, which shows Done or Pending next to every setup item.
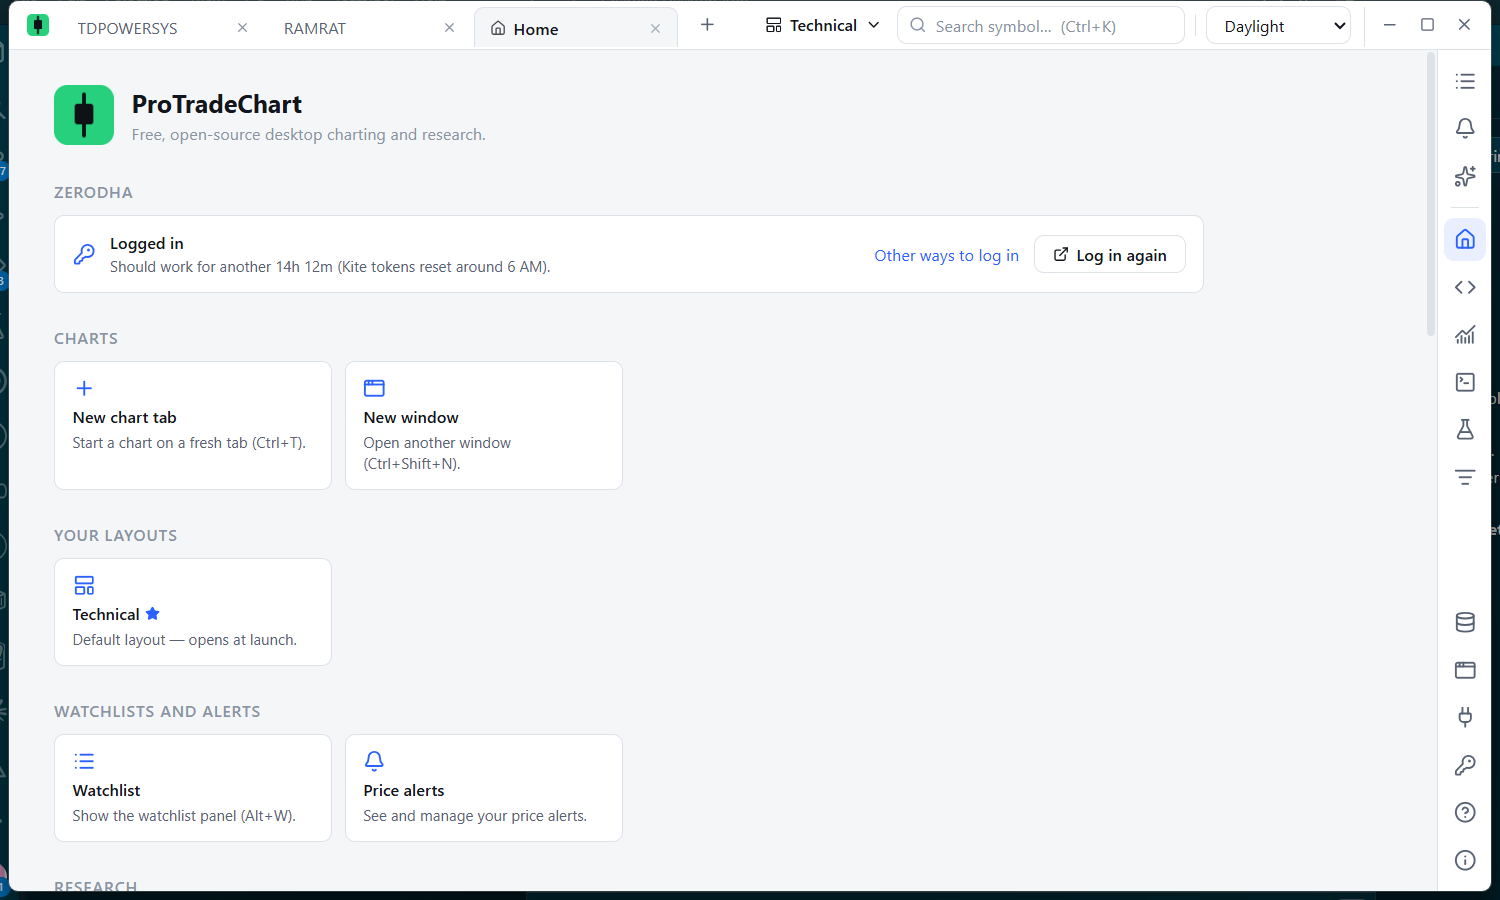
Step 1 — Open the app and look around
Launch ProTradeChart. You land on a chart. Take a minute with The main window to learn what the tab bar, chart toolbar, side panel and right rail do.
Step 2 — Connect Zerodha
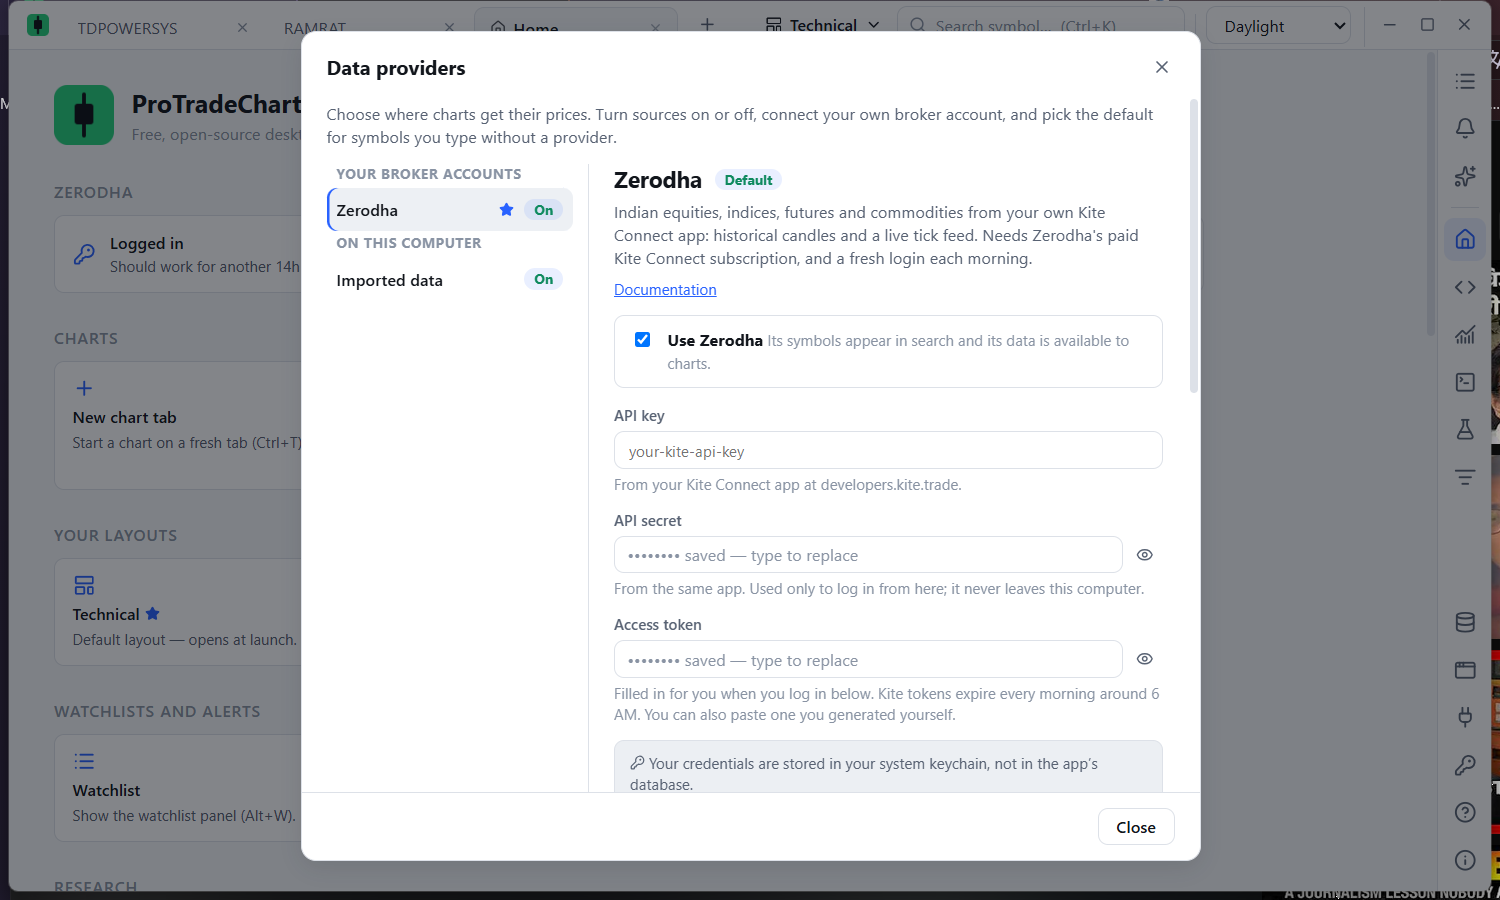
Live prices for NSE, BSE, NFO and MCX come from a Zerodha account you already have (with a Kite Connect market-data subscription). You need to do this once, then log in again each morning. It also unlocks the Screener, Python and Studies.
- Click the plug icon at the bottom of the right rail to open Data providers.
- Select Zerodha, enter your Kite Connect API key and API secret and press Save.
- Press Log in with Zerodha and sign in on the page that opens. See Connecting Zerodha for the one setting you need in your Kite app.
- Press Test connection to confirm it works.
No broker account? You can still chart your own data — see Importing your own data.
Step 3 — Load your first chart
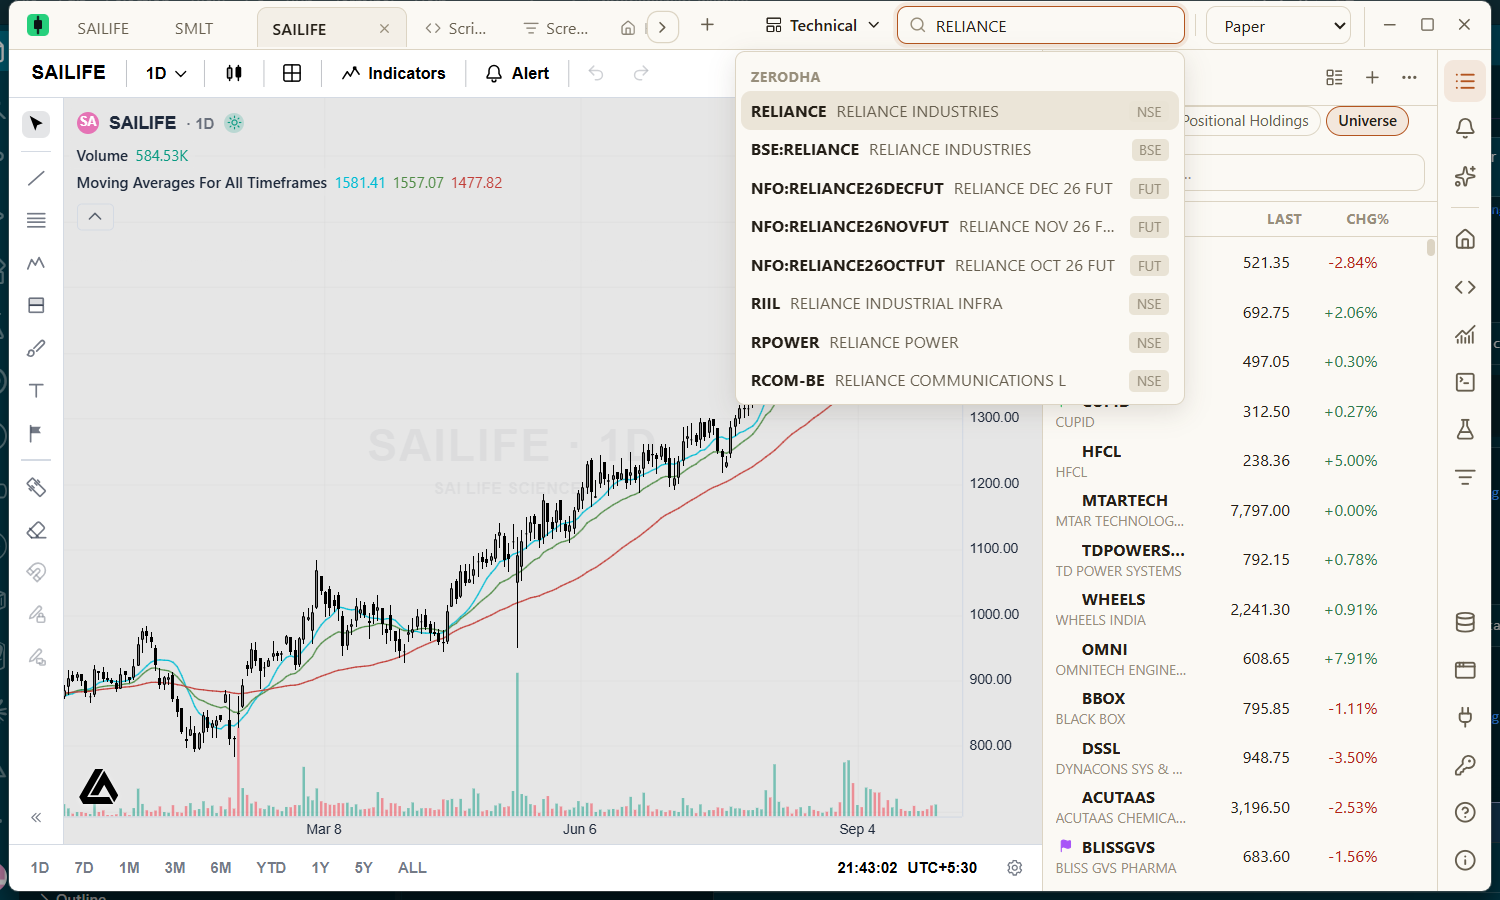
- Press
Ctrl+Kor click the search box at the top. - Type a symbol — for example
RELIANCE— and choose it from the list. - Use the chart toolbar to pick a timeframe (such as 1D or 15m) and a chart type.
Step 4 — Choose a theme
Pick one of six themes from the selector at the top right of the window: Daylight, Paper, Midnight, Graphite, Ocean or Terminal. See Appearance and themes.
Step 5 — Keep the market loaded (optional, recommended for research)
If you plan to use the Screener, Studies or Python scripts on the whole Indian market, tick Keep the market loaded under Data providers → Market data. The app then reads five years of daily prices for every NSE stock into memory — about 15 minutes at Zerodha's pace, and about 200 MB of memory — so whole-market runs take seconds. Nothing is saved to disk: it is cleared when you close the app and loaded again the next time. Read Data usage and storage first, then see Keep the market loaded.
Step 6 — Set up Python (optional)
Needed for the Screener, Studies and Python scripts. Install Python 3.10 or newer, open the Python tab and press Set up Python. See Python scripts.
Step 7 — Add an AI key (optional)
To use Ask AI and the AI helpers in Studies, add your own Claude or OpenAI key under AI providers (the key icon on the right rail). See AI providers.
Step 8 — Save your workspace
- Arrange your chart tabs the way you like them.
- Open the Layout menu in the tab bar and choose Save as new layout….
- Choose Set as default so the app opens this layout every time. New tabs also start as a copy of its first chart.