Charts
Chart grids and sync
Show up to sixteen charts in one tab and link them together.
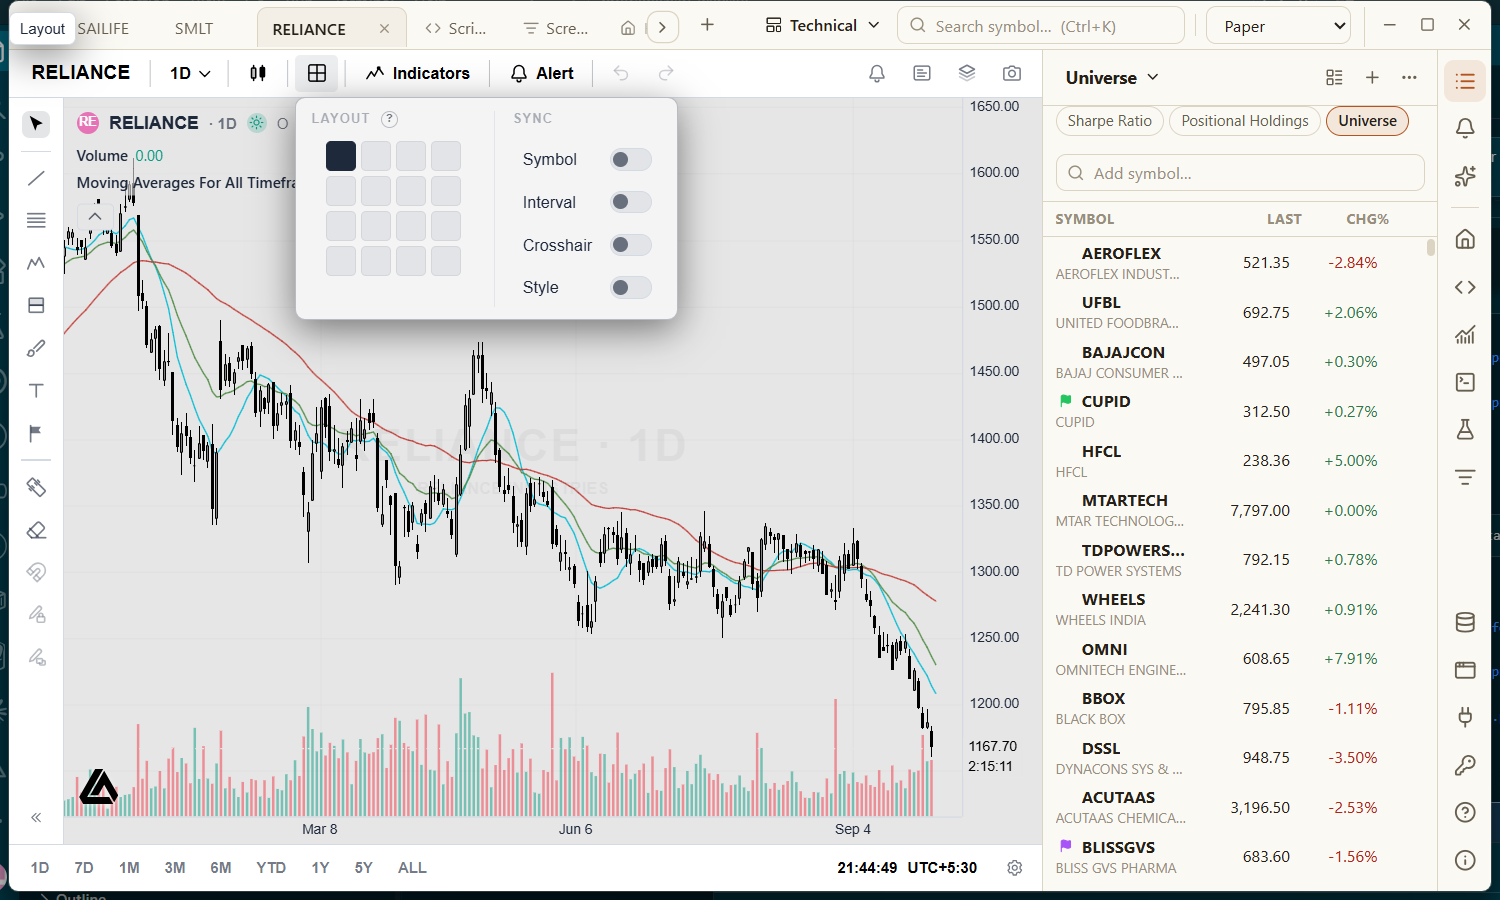
- Click the Layout button in the chart's toolbar (the four-squares icon).
- Choose a grid from 1×1 up to 4×4. New charts start on the tab's current symbol.
- Click a chart to make it the active one — it is outlined. Searching for a symbol or clicking a watchlist row changes only the active chart.
Synchronising charts
The sync switches link the charts of the grid:
- Symbol — every chart follows the active one.
- Interval — all charts share a timeframe.
- Crosshair — the crosshair moves across all charts together.
- Style — chart type and appearance are shared.
A grid is saved with the tab when you save a layout.