Charts
Working with charts
Timeframes, chart types, indicators, drawings and history.
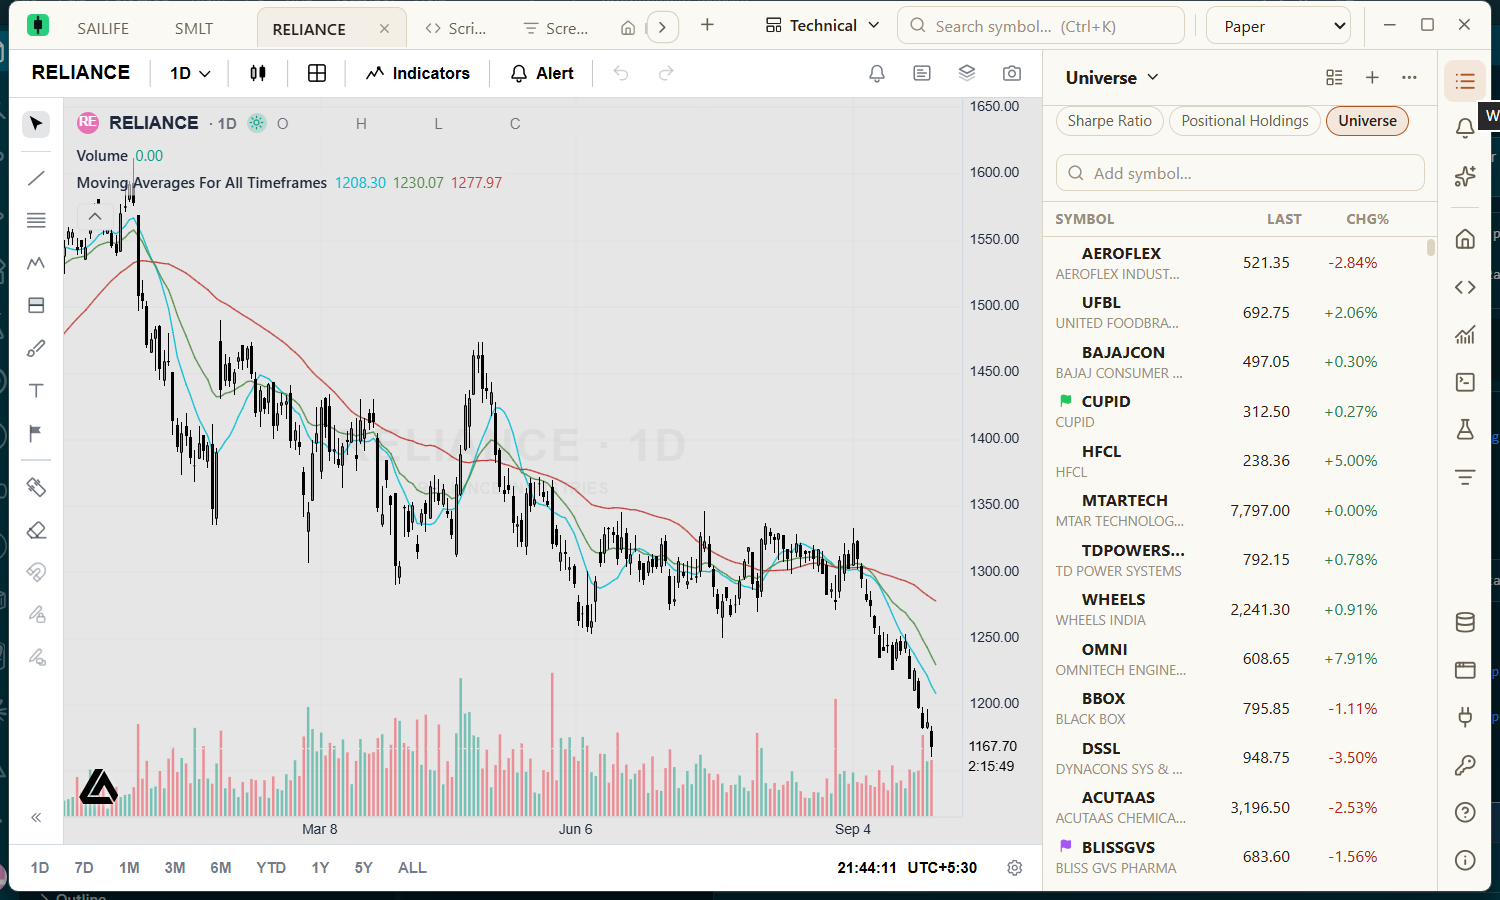
The chart toolbar
The toolbar across the top of each chart holds the symbol, the timeframe (one minute to monthly), the chart type (candles, bars, line, area, baseline and Heikin Ashi), Indicators, the grid Layout button and Alert. The drawing tools run down the left edge. Press ? on a chart to see its keyboard shortcuts.
Indicators
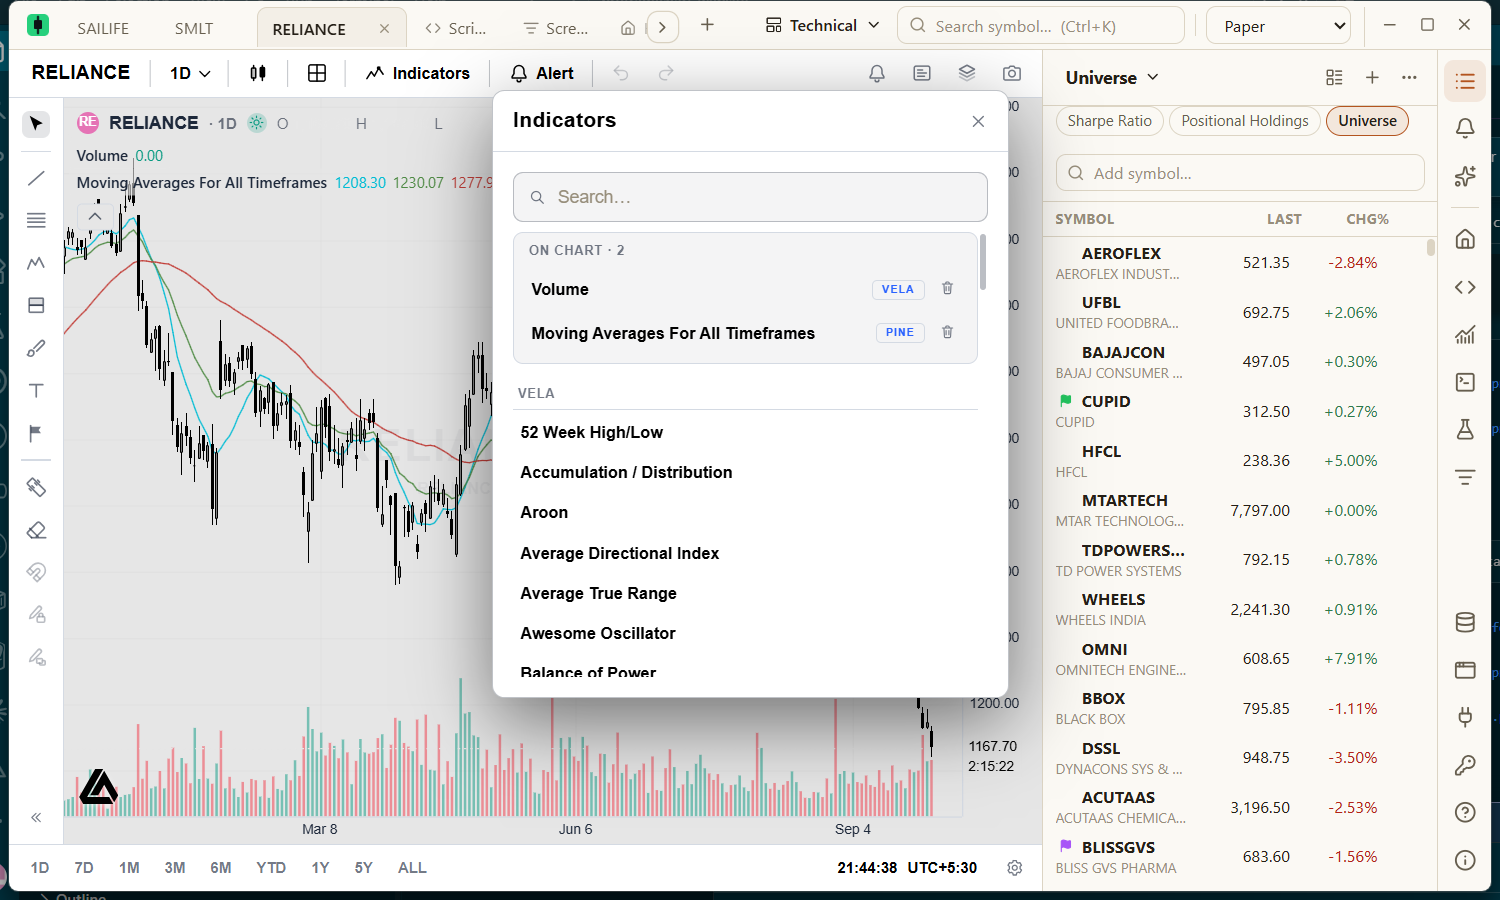
- Built-in indicators. Choose from more than seventy. Each indicator's legend row on the chart lets you open its settings, hide it or remove it.
- Bundled scripts. Pine scripts that ship with the app appear in the dialog, grouped by folder.
- Your own scripts. Write or paste a Pine Script in the Script Editor and add it to the chart. See Script Editor.
Drawings
Use the drawing tools on the left to add trend lines, horizontal lines, shapes and text. Drawings belong to the symbol: a line drawn on RELIANCE appears on every RELIANCE chart — in any tab, window or layout, at every timeframe — and disappears when that chart switches to another symbol. They are saved automatically a moment after each change.
History
A chart opens with about 500 bars — roughly two years of daily candles. Scroll or zoom towards the oldest bar and older history loads in the background for as long as the source has it. There is nothing to click. Bars you have loaded are held in memory while the app is open — never saved on your computer — so a chart can still be drawn if the connection drops.
Time and prices
- Charts use your computer's time zone. Daily, weekly and monthly bars are stamped with the exchange's calendar date.
- Timeframes a broker does not serve directly (such as 2 hours, 4 hours, weekly, monthly) are built from finer bars.
- Prices are shown as the data source supplies them. Broker history is adjusted for corporate actions by the broker.
Shortcuts from the chart
- Right-click the chart and point to Add SYMBOL to watchlist to tick the lists it should be on.
- Right-click the chart and choose Add alert here…, or right-click the price axis and choose Add alert at this price….