Data and settings
Importing your own data
Chart any instrument from a CSV file of prices.
- Press Import data (database icon) on the right rail and choose Choose CSV file….
- Check the detected columns and Bar size, and correct them if needed.
- Give the data a Ticker and optionally a description, then import it.
- Open it by searching for its ticker, or from Imported datasets in the same dialog.
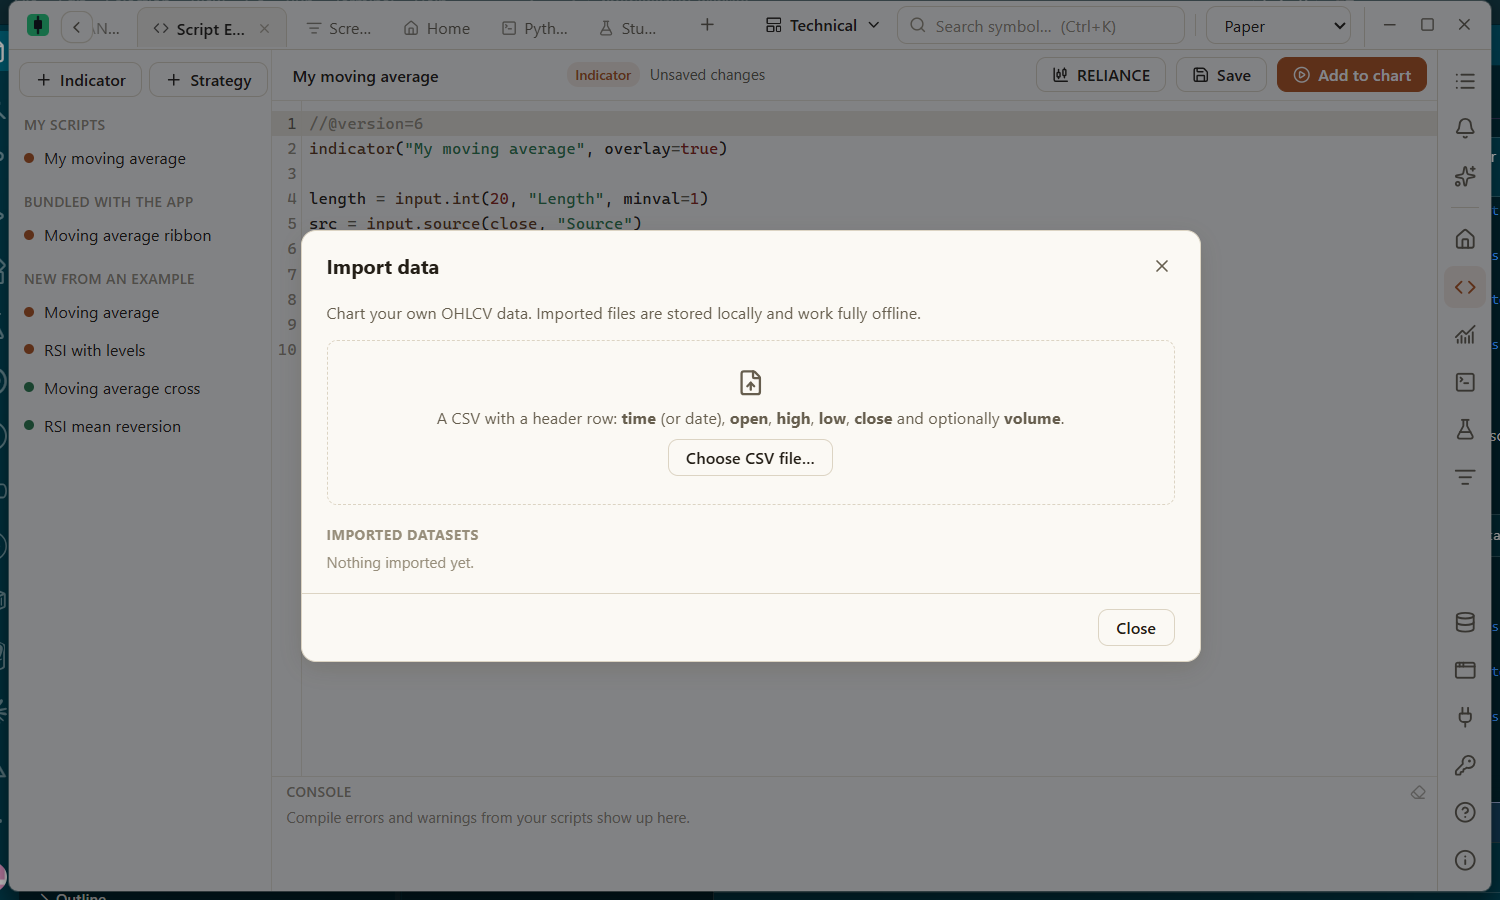
Imported data can be charted at its own bar size or any coarser one — one-minute data can be viewed as 5-minute, hourly, daily, weekly or monthly. It is also available to Python scripts as csv:TICKER.
File format
time,open,high,low,close,volume
2024-01-02,187.15,188.44,183.89,185.64,82488700
2024-01-03,184.22,185.88,183.43,184.25,58414500- A header row is required; column names are matched regardless of capitals. Volume is optional.
- The time column may be called
time,date,datetimeortimestampand may be written as2024-01-02,2024-01-02 09:15, ISO 8601,YYYYMMDD, epoch seconds or milliseconds, orDD/MM/YYYYorMM/DD/YYYY. A time without a time zone is read in your local time zone. - Commas, semicolons or tabs may separate columns.
- Rows are sorted and de-duplicated. Rows with a missing or non-positive price are skipped and reported.