Getting started
Introduction
What ProTradeChart is, what it can do and what it needs.
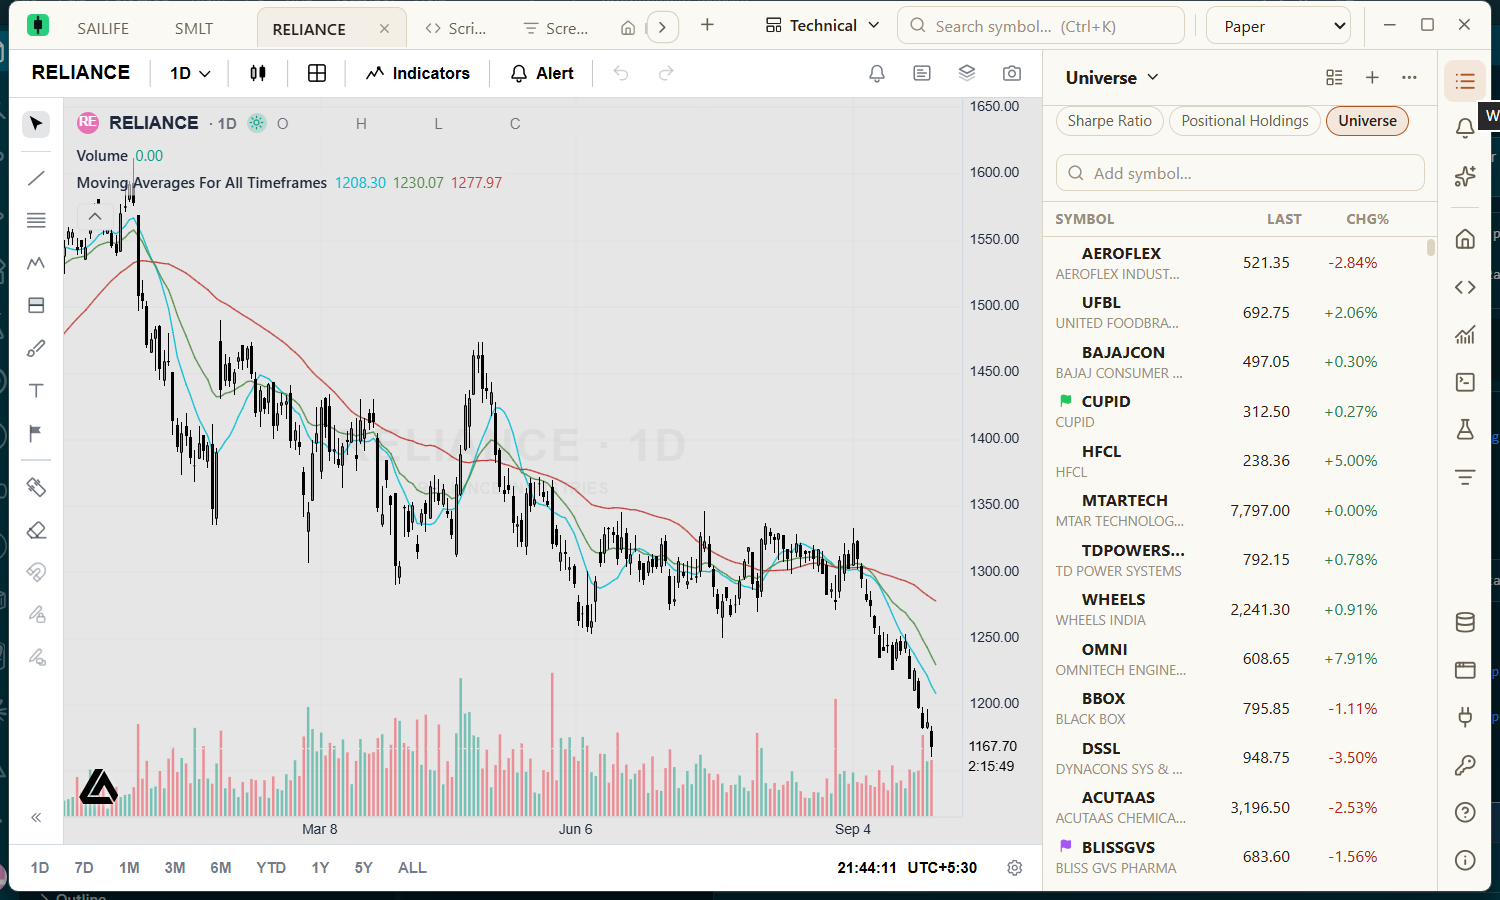
ProTradeChart is a free, open-source desktop application for charting and researching financial markets. It runs on your own Windows, macOS or Linux computer, needs no account and has no subscription.
What you can do with it
- Chart NSE, BSE and MCX instruments (or your own data) with fast candlesticks, bars, lines, areas and Heikin Ashi, from one minute to monthly.
- Add indicators — more than 70 are built in — and draw trend lines, shapes and notes.
- Keep watchlists with live prices, sections and colour flags, and get price alerts.
- Write Pine Script®-compatible indicators and strategies and backtest them.
- Research the Indian market with the Screener, Python scripts and historical Studies.
- Ask AI to explain things or set up your chart, using your own Claude or GPT key (optional).
Where the prices come from
| Source | What you get |
|---|---|
| Zerodha (your account) | Indian equities, indices, futures and commodities (NSE, BSE, NFO, MCX), with history and a live feed. You connect your own Zerodha Kite Connect account; see Connecting Zerodha. |
| Your own CSV files | Chart any instrument you have price data for. See Importing your own data. |
What you need
- Windows 10 or 11 (64-bit), macOS (Apple Silicon or Intel), or 64-bit Linux (.deb or .rpm).
- An internet connection for live prices and history. Imported data works offline; broker prices are held in memory while the app is open and are not saved.
- A Zerodha account with a Kite Connect market-data subscription for Indian markets, Python 3.10+ for the research tools, and a Claude or OpenAI API key for the AI features.
New here? Go to Installing and then First-time setup.